How to read your Try-on analytics
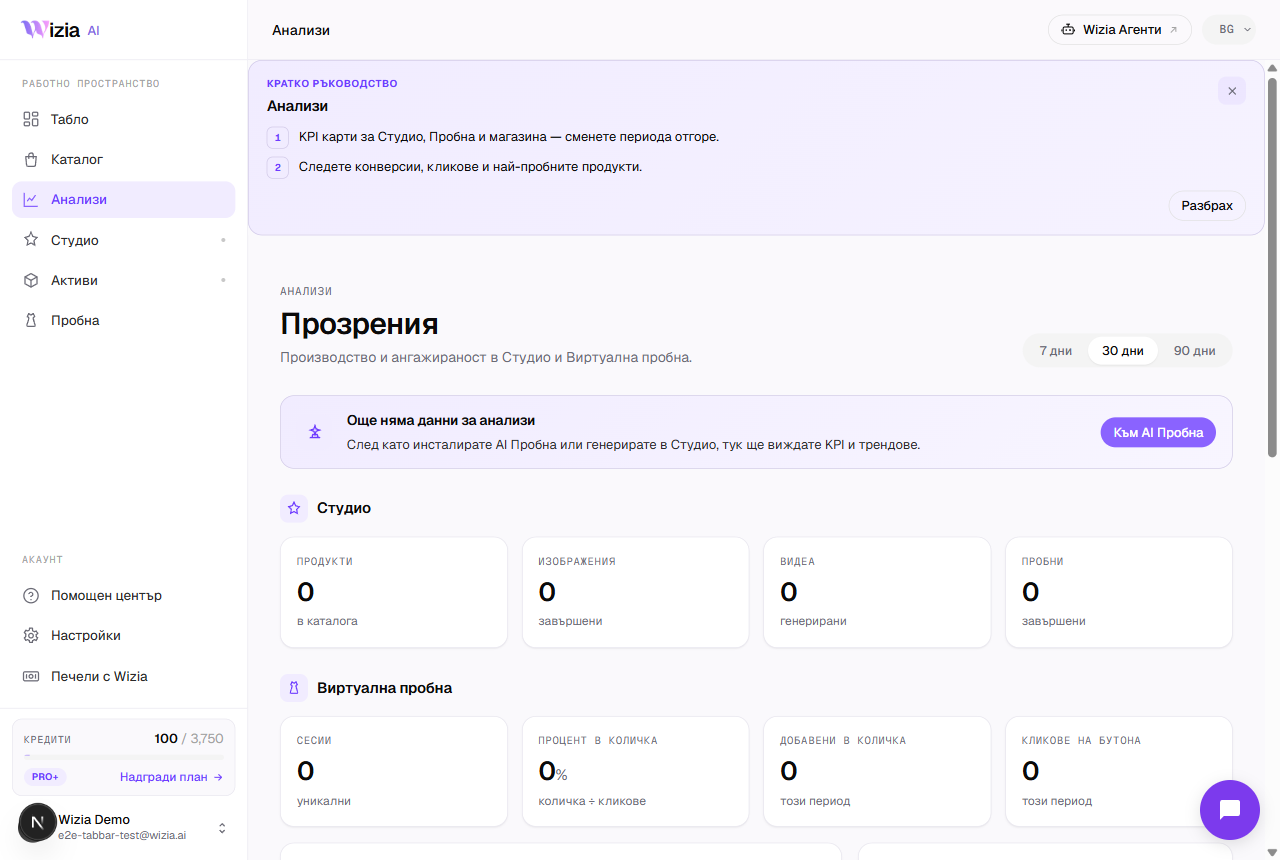
The Try-on page has three tabs: Analytics shows how shoppers use the try-on, Personalize controls how the button looks, and Settings manages limits and quality. Here's how to read each one.
The conversion funnel
- 1
Clicks
How many times shoppers pressed the try-on button on your product pages. This is the top of the funnel.
- 2
Try-ons
How many try-ons were completed — the shopper uploaded a photo and got a result.
- 3
Add to cart
Add-to-cart actions recorded after a try-on on the same page.
- 4
Purchases
Completed orders detected on the order-confirmation page. The conversion figure at the top is the try-ons → purchases ratio.
Trend and top products
The trend chart shows try-ons per day for the last 30 days — look for the effect of campaigns and new products. The top-products table ranks products by try-on count with share and last-tried date — this is the list of products shoppers are genuinely considering.
Why the numbers can lag
Events come from the shopper's browser via the widget. Ad blockers and aggressive caching can stop some of them, and purchases are recognized by typical confirmation pages (“thank you”, “order received”, and similar) — if your confirmation page has an unusual URL, purchases may be undercounted. Watch the trends, not individual days.
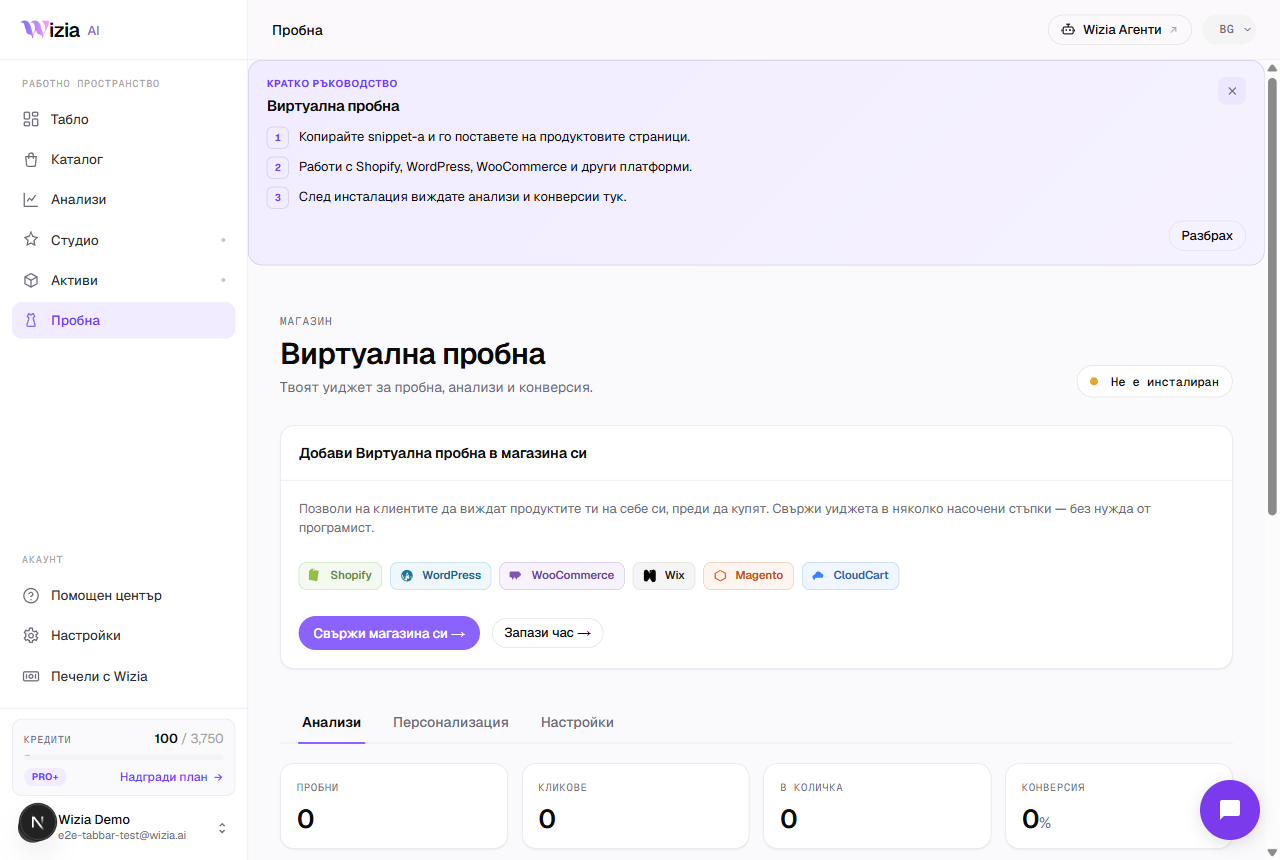
Personalize and Settings
In Personalize you change the button's text, color, position, size, corner radius, and logo — with a live preview. In Settings you set daily try-on limits: for anonymous shoppers (3 per day by default) and registered ones (10 by default), a message shown when the limit is reached, and a default quality of 1K, 2K, or 4K.